Titration is the measurement of the volume of a solution of one reactant that is required to react completely with a measured amount of another reactant.
As both the reactants are taken in the form of solution and the titration is the measurement of volume of one solution that must be added to another solution till the reaction is complete, this method of quantitative analysis is called volumetric analysis.
The concentration of the solution called as standard solution is known and it is desired to find the concentration of other by titration.
Contents
- 1 Apparatus of Titration
- 2 Theory of acid base indicators
- 3 pH at the end point of acid – base Titration
- 4 Titration Curve
- 5 Selection of a Suitable Indicator
- 6 Colour change pKindicator =pH at the equivalence point
- 7 pH range of 2 units of indicators
- 8 Calculation of pKa pr pKb values from pH of equivalence point
- 9 Calculation of Volumetric Analysis
Apparatus of Titration
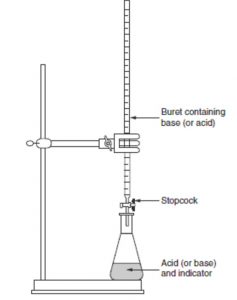
Procedure
1) A known volume of the solution is taken in the titration flask with the help of a pipette.
2) The other solution is taken in the burette which is graduated in cc’s and has a stop cock at bottom to control the amount of flow into the flask.
3) The solution to be titrated is taken in the flask and is called titrate and the solution with which the titration is to be done that is taken in the burette is called the titrant.
The point at which the required volume of one solution has been added to the other to exactly complete the reaction between the two is called end point or equivalence point.
Types of titrations
(1) Redox titrations involving oxidation and reduction.
(2) Acid -base titrations involving neutralization
(3) Precipitation titration
(4) Complexometric titration involving formation of complexes.
The substance usually added into the solution taken in the titration flask to detect the equivalence point is called an indicator
Theory of acid base indicators
Acid base indicators are mostly complex organic molecules which are either weak acid or weak bases
For ex: Phenolphthalein is a weak organic acid (HPh) and methyl orange is a weak organic base ( MeOH) .
Phenolphthalein and methyl orange dissociates in aqueous solution as :
HPh ![]() H+ + Ph‾ ————— (1)
H+ + Ph‾ ————— (1)
colourless pink
MeOH ![]() Me+ + OH‾ ————–(2)
Me+ + OH‾ ————–(2)
Yellow red colourless
The unionized form has one colour and the ions have different colour.
For Ex: HPh is colourless while Ph ions have pink colour. Similarly , MeOH has yellow colour while Me+ have red colour.
As the medium changes from acidic to basic or vice versa , the equilibrium shifts either towards the right or towards the left and so the colour changes.
In acidic medium the equilibrium 1 is towards left and the solution is colourless while in the basic medium, OH‾ ions will combine with the H+ to form unionized water molecules, the equilibrium shifts towards the right and the solution has a pink colour.
In methyl orange in basic medium the equilibrium 2 is towards left and the colour is yellow while in the acidic medium H+ ions combine with the OH‾ ions and the equilibrium 2 shifts towards the right and the colour is red.
Phenolphthalein cannot be used as an indicator if the base is weak because the OH‾ ions produced from the weak base are insufficient to shift the equilibrium 1 towards the right.
Methyl orange is not a suitable indicator if the acid is weak because the H+ ions produced are insufficient to combine with OH‾ ions and shift the equilibrium 2 towards the right.
pH at the end point of acid – base Titration
(1) If strong acid has been titrated with strong base, the pH at the end point is 7.
(2) If a weak acid or a weak base is involved in the titration, pH at the end point depends upon the hydrolysis of salt formed.In any type of acid-base titration, it is found that there is a sudden change in the pH value at the end.
As the titration proceeds, if the pH values of the solution are measured or calculated theoreically and then plotted against the volume of the solution added, the curve obtained is called titration curve.
Titration Curve
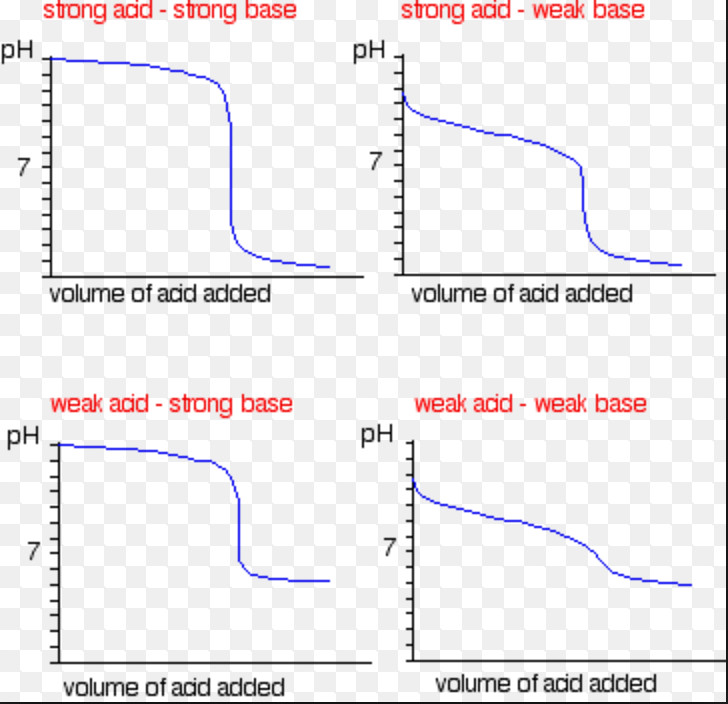
The point at which there is sudden change in pH when a very small amount of titrant is added to the titrate is called point of inflection.
The steepness of the slope around the equivalence point is quite large in case of titration of strong acid against strong base whereas it is less steep if the acid or base is weak.
Large steepness means large change in pH on adding a very small volume of the solution. It may be pointed out that if a weak acid is titrated against a weak base, the change in pH at the end is so small that it is difficult to determine the end.
Selection of a Suitable Indicator
The indicator used should be such that it shows change in colour in the same pH range as required around the equivalence point.
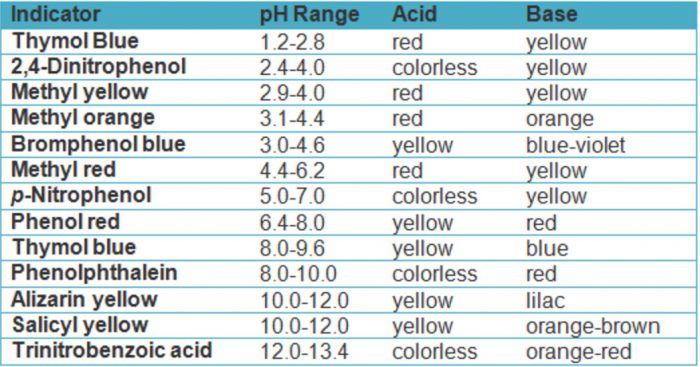
(1) For titration of a strong acid against a strong base, any indicator out of methyl orange, methyl red, phenolphthalein or bromothymol blue can be used to determine the endpoint.
(2) For titration of weak acid like acetic Acid against a strong base, only phenolphthalein is a suitable indicator.
(3) For titration of weak base against strong acid ,methyl orange or methyl red or bromothymol blue can be used as an indicator.
(4)For titration of weak acid with weak base ,no indicator is found to function satisfactorily.
Colour change pKindicator =pH at the equivalence point
Consider an indicator which is a weak organic acid.Let it be represented by HIn. In aqueous solution , it dissociates as:
HIn (aq) ![]() H+ (aq) + In‾ (aq)
H+ (aq) + In‾ (aq)
HIn and In‾ have different colours.The equilibrium constant for the above reaction is :
KIn = [H+] [In‾ ] / [HIn]
The exact point of colour change will be at the pH when [HIn] = [In‾ ]
KIn = – log kIn = – log [H+]
For a particular titration , the indicator selected should be such for which pKIn = pH
pH range of 2 units of indicators
Most of the indicators have a useful colour change over a pH range of 2 units.
For Ex: Phenolphthalein , change from colourless to pink in the pH range of 8.3 to 10.
For an indicator HIn
HIn ( aq) ![]() H+ (aq) + In‾ (aq)
H+ (aq) + In‾ (aq)
KIn = [H+] [In‾ ] / [HIn]
Acidic colour [In‾ ] / [HIn] = 1 / 10
Alkaline colour [In‾ ] / [HIn] = 10/1
[H+] = { [HIn] / [In‾ ] } KIn
For acidic colour to be visible
[H+] = 10 KIn
– log [H+] = -log 10 – logKIn
pH = pKIn – 1
For alkaline colour to be visible
[H+] = ( 1 / 10 ) KIn
– log [H+] = log 10 – logKIn
pH = pKIn +1
pH range for colour change is from pKIn – 1 to pKIn + 1 i.e. a pH range of 2 units.
Calculation of pKa pr pKb values from pH of equivalence point
For a weak acid , HA
HA ![]() H+ + A‾
H+ + A‾
Ka ={ [ H+ ] [ A‾ ] } / [HA ]
[ H+ ] = { [HA ] / [ A‾ ] } / Ka
– log [ H+ ] = – log Ka – log [HA] / [A‾ ]
pH = pKa – log [HA] / [A‾ ]
The half equivalence point is the point in the neutralisation at which one half of HA has been neutralised in the reaction:
HA + OH‾ ![]() H2O + A‾
H2O + A‾
At this point,
[HA] = [A‾ ]
pH = pKa – log 1 = pKa
At the half equivalence point
pH = pKa
Calculation of Volumetric Analysis
Suppose the two reactants involved are A and B. Suppose V1 cc of the solution of reactant A having normality N1 exactly with V2 cc of the solution of reactant B having normality N2.
Number of gram equivalent of A reacted = N1 × V1 / 1000
Number of gram equivalent of B reacted = N2 × V2 / 1000
As the reactants react in equivalent amount , N1 × V1 / 1000 = N2 × V2 / 1000
N1 × V1 = N2 × V2
This is called Normality equation
Normality of an acid ( Na ) = Molarity ( Ma ) × Basicity of the acid ( na )
Normality of an acid ( Nb ) = Molarity ( Mb ) × Basicity of the acid ( nb )
Na × Va = Nb × Vb
na Ma Va = nb Mb Vb
Ma Va = Mb Vb
These are called as molarity equation
n1 M1 V1 = n2 M2 V2
M1 V1 = M2 V2
Thnx by this site my all confusions are finished and now I m totally ready for my practical exam
Really… It’s very helpful
Thnx ma’am for such a really helpful website. But a kind suggestion would be to include some practice questions after the end of the topic