Maxwell-Boltzmann distribution of Molecular speed
At a particular temperatures, different molecules of a gas possess different speeds. Due to continues collision among the molecules themselves and against the walls of the container ,their speed keep on changing.
As a result of collision, some others are speeded up, some others are slowed down and hence the fashions of molecules possessing particular speed remain constant at constant temperature.
If fractions of molecules possessing particular speed are plotted against their corresponding speeds at a particular temperature, a curve is obtained. This distribution of speed is called maxwell-Boltzmann distribution.
From this curve, it may observed that,
(1) Fraction of molecules having too low or too high-speed are very small.
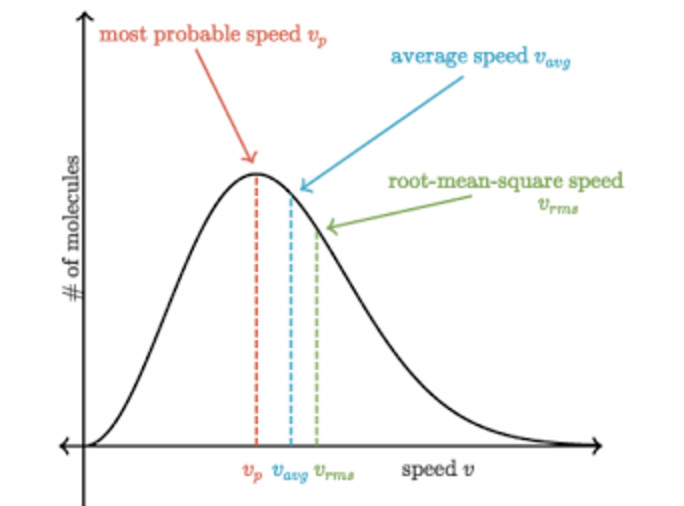
(2) The peak of the curve corresponds to a speed possessed by the maximum fraction or maximum number of molecules. This speed is called most probable speed and is represented by c∗
Effect of nature of the gas
At the same temperature, lighter gas will have higher value of most probable speed i.e. move faster than heavier gases.
For example : Distribution curve for chlorine and nitrogen gases are:
Effect of temperature
Maxwell – Boltzmann distribution curve for a gas at three different temperatures is
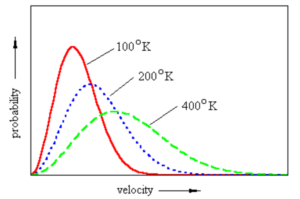
(1) The peak shift forward showing that the most probable velocity increases.
(2) The peak shift downwards showing that fraction of molecules or number of molecules possessing most probable velocity decreases.
(3) The curve is flattened in the middle showing that more molecules have speeds near to the most probable speed.
(4) The fraction of molecules having higher speed increases.
(5) The fraction of molecules having lower speed decreases.
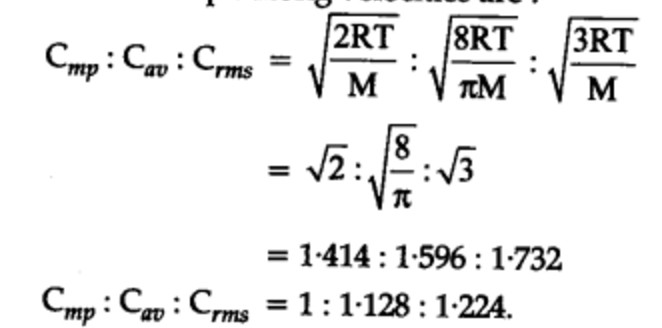
Relationship between different types of speed
THANKS
Thanks a lot
thanks very much
It’s very Helpful and thanku
Thank you very much