Question 1 What is the nature of graph for a uniform speed?
Question 2 Name the quantity which is measured by the area occupied under the velocity-time graph?
Question 3 What does the slope of speed-time graph indicate?
Question 4 What can you say about the motion of a body if its displacement-time graph is a straight line?
Question 5 What can you say about the motion of a body if its velocity-time graph is a straight line?
Question 6 Name the quantity, the slope of whose graph give Speed?
Graphical Representation of Motion
Distance – Time graphs
(1) Uniform Speed
Straight line graph between distance and time tells us that body is moving with uniform speed. Slope of distance time graph indicates speed.
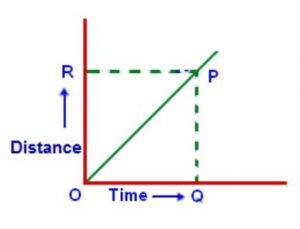
Slope = PQ/OQ
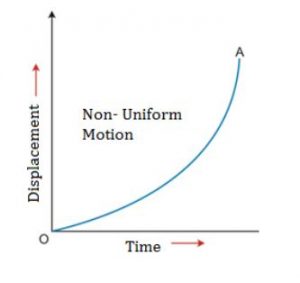
(2) Non-Uniform speed
The distance time graph for a non-uniform motion is a curved line (parabola). If a body moves with a non-uniform speed then its motion is said to be accelerated. It also represents distance time graph with accelerated motion.
Speed – Time or velocity – Time Graphs
(1) Speed-time graph when speed remains constant
(a) Speed time graph for a body moving with constant speed(no acceleration) is a straight line parallel to time axis. We can find the distance travelled by a body in a given time from speed-time graph.
Speed = Distance travelled / Time taken
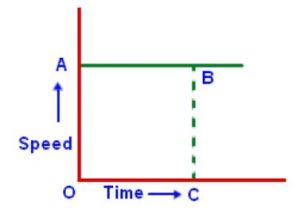
OC x BC = Distance travelled
OC x OA = Time taken
Distance travelled = Area of rectangle OABC
The velocity time graph of an object moving with constant velocity is a straight line parallel to time axis.
(2) Speed-time graph when speed changes at uniform rate (uniform acceleration)
(1) When a body moves with uniform acceleration ,its speed changes by equal amount in equal intervals of time.
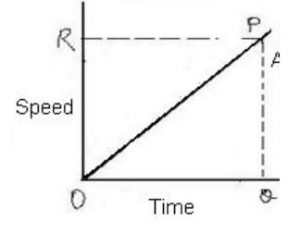
Speed time graph for a uniformly changing speed will be a straight line.
The value of acceleration from speed time graph of moving body can be calculated as:
a = Change in speed or velocity / Time taken
a = PQ/OQ
In a speed time graph the acceleration is given by slope of the graph.
The distance travelled by a moving body in a given time can be calculated from speed time graph.
Distance travelled = Area of triangle POQ
= 1/2 x OQ x OP
In a speed time graph of a body a straight line sloping downwards indicates retardation.
Speed time graph when the initial speed of the body is not zero.
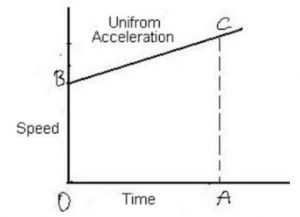
The distance travelled by the body in this case is equal to the area of trapezium OBCA.
Area of Trapezium = (Sum of parallel sides x Height) / 2
Distance Travelled = ((OB + AC) x OA)/2
(3) Speed – Time graph when speed changes at a non-uniform rate (Non-uniform acceleration)
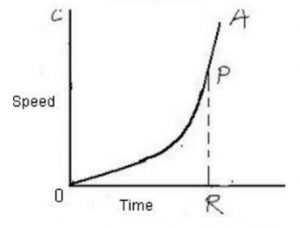 When the speed of a body changes in an irregular manner, then speed-time graph of a body is curved line.
nice graphs help me a lot….
yes khushi you are right it is very helpful
Nice representation of graph mam.
You are absolutely right Richa
Yeah!! Really very helpful graphs…
I was not able to understand the graphical representation of motion when ma’am was teaching virtually… In fact, I was not able to understand the whole chapter… These graphs have literally helped me lot….. Thank You very much..
Really Helpful
Too good this helps a lot . Although i knew all of them as i m the imo rank 1 holder since last 3 years
Ammazing notes thax for helping me
thanks for the notes
Your graph help me a lot. Thanks ❤
Yes,it helped me to do my science assignment
Thanks
Yes , these graphs helps me a lot tommorow is my paper I don’t even understood this till 11:00 am today …. Now it is 12:18 pm now I m able to this graph very nicely ….. Thank u very much for these graphs
Excellent it helps me a lot
Hamari mam ne ya link hume diya iit is
Very nice thanks mam aapka bhot bhot abhari
Really nice representation of graphs of motion, ma’am