Question 1 Draw a distance-time graph to show the motion of a car moving with a uniform speed?
Question 2 Draw a distance-time graph to show the motion of a car moving with a non-uniform constant speed?
Question 3 Draw a distance-time graph when the object is stationary?
Question 4 State few advantages of drawing distance-time graph?
Question 5 In a distance-time graph what type of motion does a straight line represent?
Question 6 In a distance-time graph what type of motion does a curved line represent?
Question 7 What is a bar graph?
Question 8 What is a pie chart?
Contents
Graphical Representation of Motion
A distance-time graph shows how distance travelled by a moving object changes with time.
(1) Distance-Time Graph for Uniform Speed (or Constant Speed)
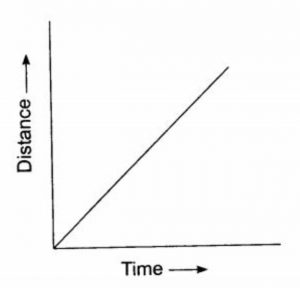
When an object moves with a uniform speed (or constant speed), it travels equal distances in equal intervals of time. So, the distance travelled is directly proportional to time. When the two things are directly proportional to each other, then the graph drawn between them is a straight line.
Thus, the distance-time graph of an object moving with a uniform speed (or constant speed) is a straight line. The straight line graph OB is sloping upwards showing that as the time increases, the distance travelled by the object increases in the same proportion.
So, if the distance-time graph of an object is a straight line, it indicates that the object is moving with a uniform speed (or constant speed).
The slope (or slant) of a distance-time graph indicates the speed of the object.
(a) If the distance time graph has a low slope (it is less steep), then the object has low speed.
(b) If the distance-time graph has a higher slope (it is more steep), then the object has a higher speed.
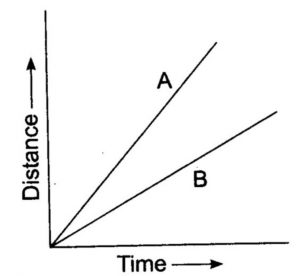
Just by looking at the slopes of two distance-time graph lines drawn on the same paper, we can tell which of the two objects is moving faster and which is moving slower. This is because greater the slope of a distance-time graph, the higher will be the speed.
In Figure , distance-time graphs have been drawn for two moving objects. Now, graph B has a smaller slope (it makes smaller angle with -axis), so graph B represents a lower speed.
The graph A has a greater slope (it makes a greater angle with x-axis), therefore, graph A represents a higher speed. So, we can now say that the object having distance-time graph A is moving faster than another object whose distance-time graph is B.
(2) Distance-Time Graph for Non-Uniform Speed (or Changing Speed)
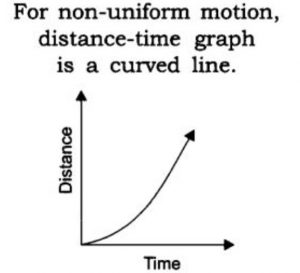
When an object moves with a non-uniform speed (or changing speed), it travels unequal distances in equal intervals of time. In this case, the distance travelled by object is not directly proportional to time and hence the distance-time graph is not a straight line.
The distance-time graph for an object moving with non-uniform speed (or changing speed) is a curved line. Thus, a curved line graph between distance and time tells us that the object is moving with a non-uniform speed (or changing speed).
The distance-time graph in the form of a curved line tells us that the object is moving with a speed which is not constant.
(3) Distance-Time Graph When the Object is Stationary (Not Moving)
After travelling a certain distance, when a moving object stops moving (or becomes stationary), then the distance travelled by it does not change with time, it remains the same (or constant).
The distance-time graph for an object which stops moving (or becomes stationary) is a straight line parallel to the time-axis (or x-axis).
A straight line graph parallel to the time-axis shows that the speed of object is zero. The distance-time graph for a stationary object is a horizontal line. (see line AB).
(a) If the distance-time graph of an object is a straight line, then it is moving with a constant speed. (The greater the slope of distance-time graph, the greater the speed)
(b) If the distance-time graph of an object is not a straight line (it is a curved line), then the speed of is not constant. The speed is changing.
(c) If the distance-time graph of an object is a horizontal line parallel to the time-axis, then the object is zero. The object is not moving. It is stationary.
How to Draw Distance-Time Graphs
(1) We use a graph paper to draw distance-time graph.
(2) The graph paper has 1 centimetre squares marked on it. Each centimetre square has 100 smaller squares in it (which are millimetre squares).
(3) The side of bigger square on the graph paper is 1 cm and that of the smaller square is 1 mm.
(4) To draw the distance-time graph for a moving object, we need a graph paper, and the readings of distances travelled by the object and the corresponding time values which have been obtained experimentally.
(5) We should draw a horizontal line on the graph paper to represent x-axis. Label the x-axis by writing Time. The unit of time should be written in bracket such as Time (s), Time (min) or Time (h). An arrow should be put in front of the labelling of time and its unit like Time (min).
(6) Draw a vertical line on the left side of the graph paper to represent y-axis. Label the y-axis by writing the word Distance. The unit of distance should be written in bracket such as Distance (m), Distance (cm) or Distance (km). An arrow should be put in front of the labelling of distance and its unit like Distance (km). The point of intersection of x-axis and y-axis is called ‘origin’ and marked as O.
(7) We should choose suitable scales so as to represent the large values of ‘time’ and ‘distance conveniently on the small graph paper. The scales to be used depend on the range of time and distance values, and hence vary from question to question.
(8) Take the first value of time and the first value of distance from the data given in the question and mark one point on the graph paper where the graph lines representing these two values meet. Then take second, third, fourth and fifth sets of values of time and distance and mark corresponding points (as pencil dots) on the graph paper.
(9) Join all the marked points (or pencil dots) with a pencil line graph to obtain the required distance time graph.
Advantages of distance-time graphs
(1) The variation of distance travelled by an object with time can be seen more easily from a distance-time graph than from the distance and time values given in the table form.
For example :
(a) A straight line distance-time graph tells us that the moving object covers equal distances in equal time intervals, so its speed is constant (or uniform).
(b) A curved line distance-time graph tells us that the moving object covers unequal distances in equal time intervals and hence its speed is not constant (it is non-uniform).
(c) A straight line distance-time graph parallel to the time-axis (or a horizontal line graph) tells us that the distance moved by the object does not change with time, so its speed is zero (it is stationary)
(2) The data given in table form may give information about the distance moved by the object only at certain definite time intervals but from a distance-time graph we can find the distance moved by the object at any point of time.
(3) The speed of an object can be obtained from its distance-time graph. By using distance-time graph, we can find the distance moved by the object between any two time readings. And if we divide this distance by time (given by the difference in the two time readings), we will obtain speed of the object.
Other Types of Graphs
Line graphs show the variation of distance travelled by a moving object (car, bus, truck, etc.) with time.There are two other kinds of graphs.
Bar Graph
A bar graph is a diagram which shows information as bars (thin rectangles) of different heights in a bar graph, the positions and heights of the bars represent the values of the variable quantity about which information is being given.
Pie Chart
A pie chart is a kind of graph or diagram which shows the percentage composition of something in the form of slices of a circle (the whole circle representing 100 per cent).


The solution is excellent
Wonderful explanation.
Excellent explanation